BTCUSD Short Setup
Short following buy-side sweep | 9th of February 2026
Trade Overview
This trade followed a clear sweep of buy side liquidity into a known resistance area. Price failed to hold above the range high, suggesting positioning rather than continuation.
The goal was to enter after liquidity was taken, aligning with institutional activity instead of chasing momentum. Risk was tightly defined with a clear invalidation level.
Trade Thesis
Entry post-sweep aligning with institutional positioning
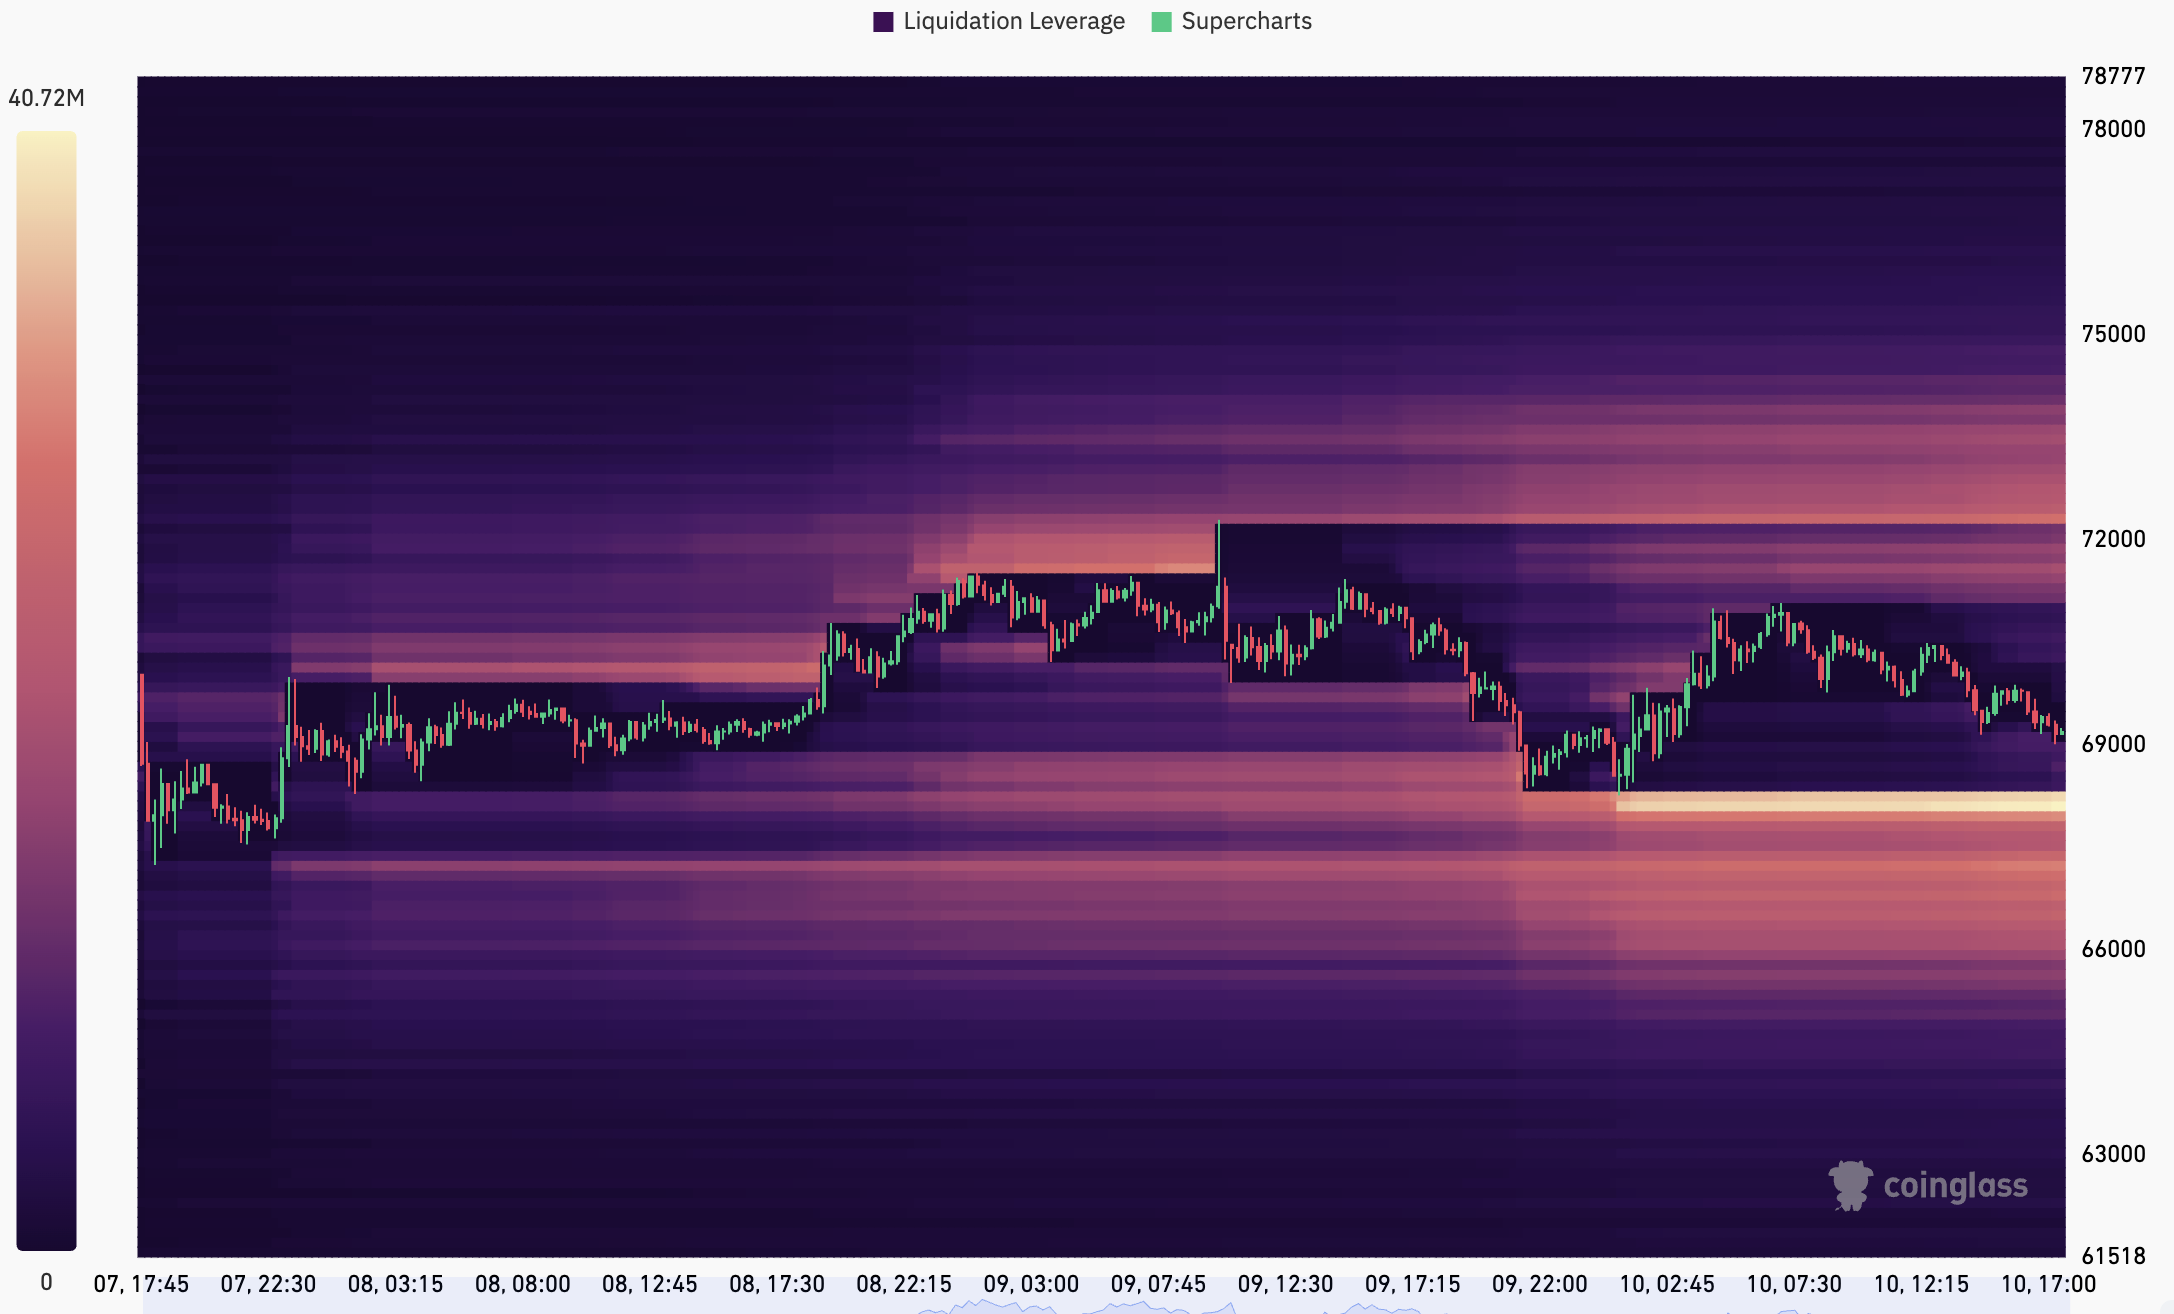
Price was driven into an area of concentrated buy side liquidity, triggering stops and breakout entries above prior highs. This provided the liquidity required for short positioning by large entities.
After the sweep, price stalled and traded back below the level, confirming rejection rather than acceptance.
Higher Timeframe Context
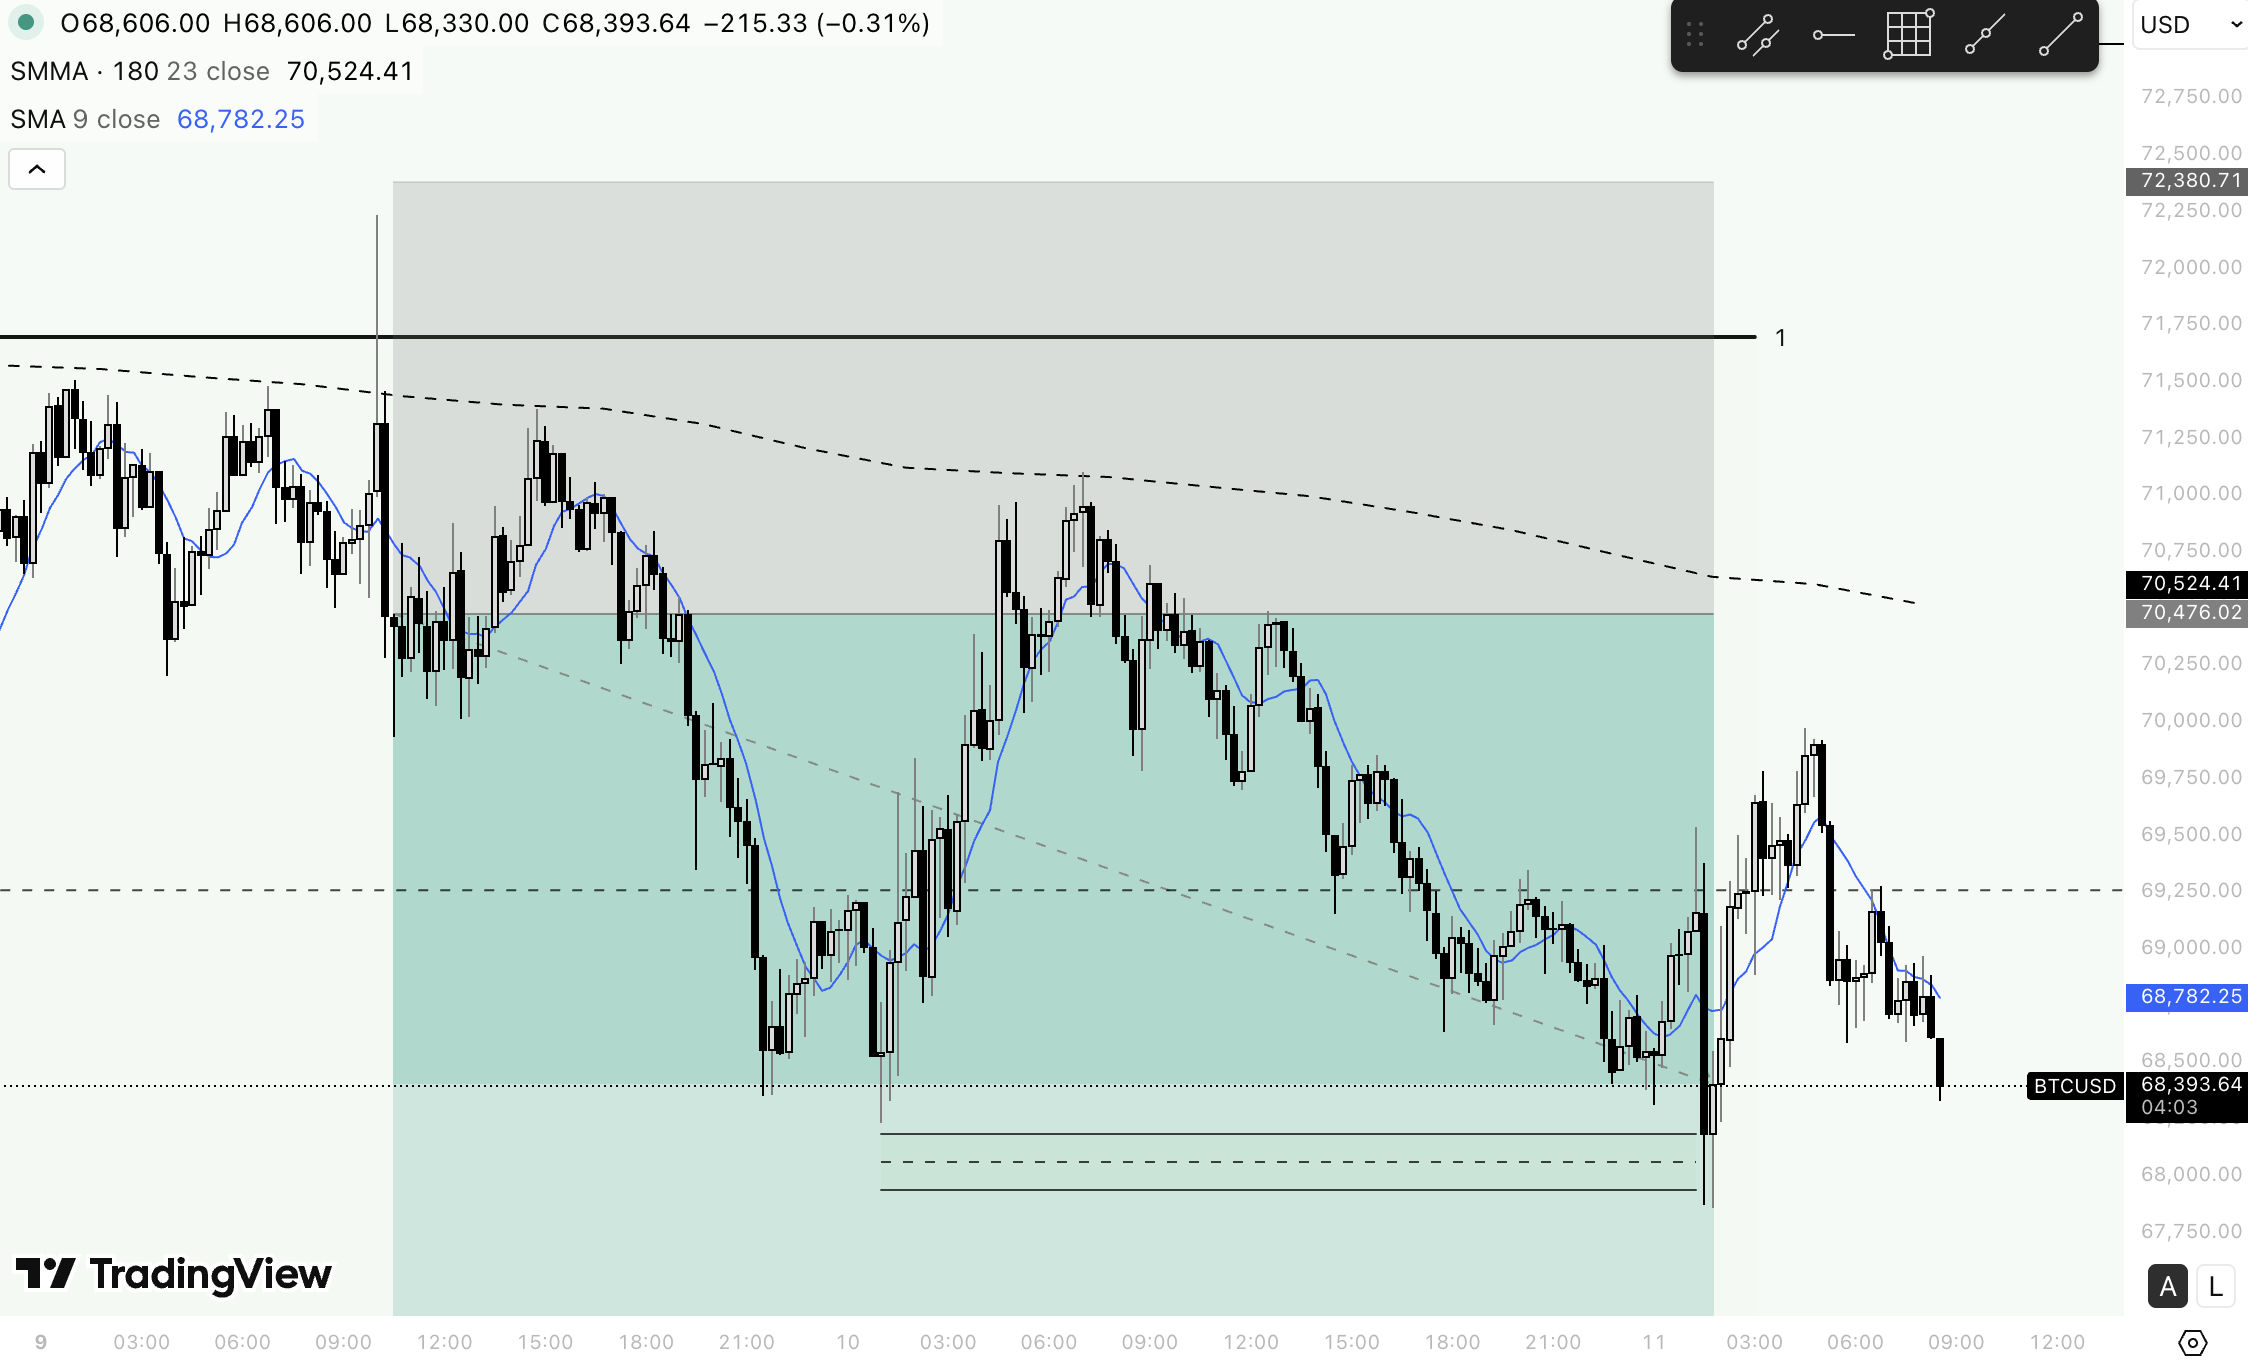
On the higher timeframe, Bitcoin remained in a bearish structure. Price rejected off of the 4 hourly 20 smoothed moving average, and failed to reclaim prior swing highs, supporting a short bias.
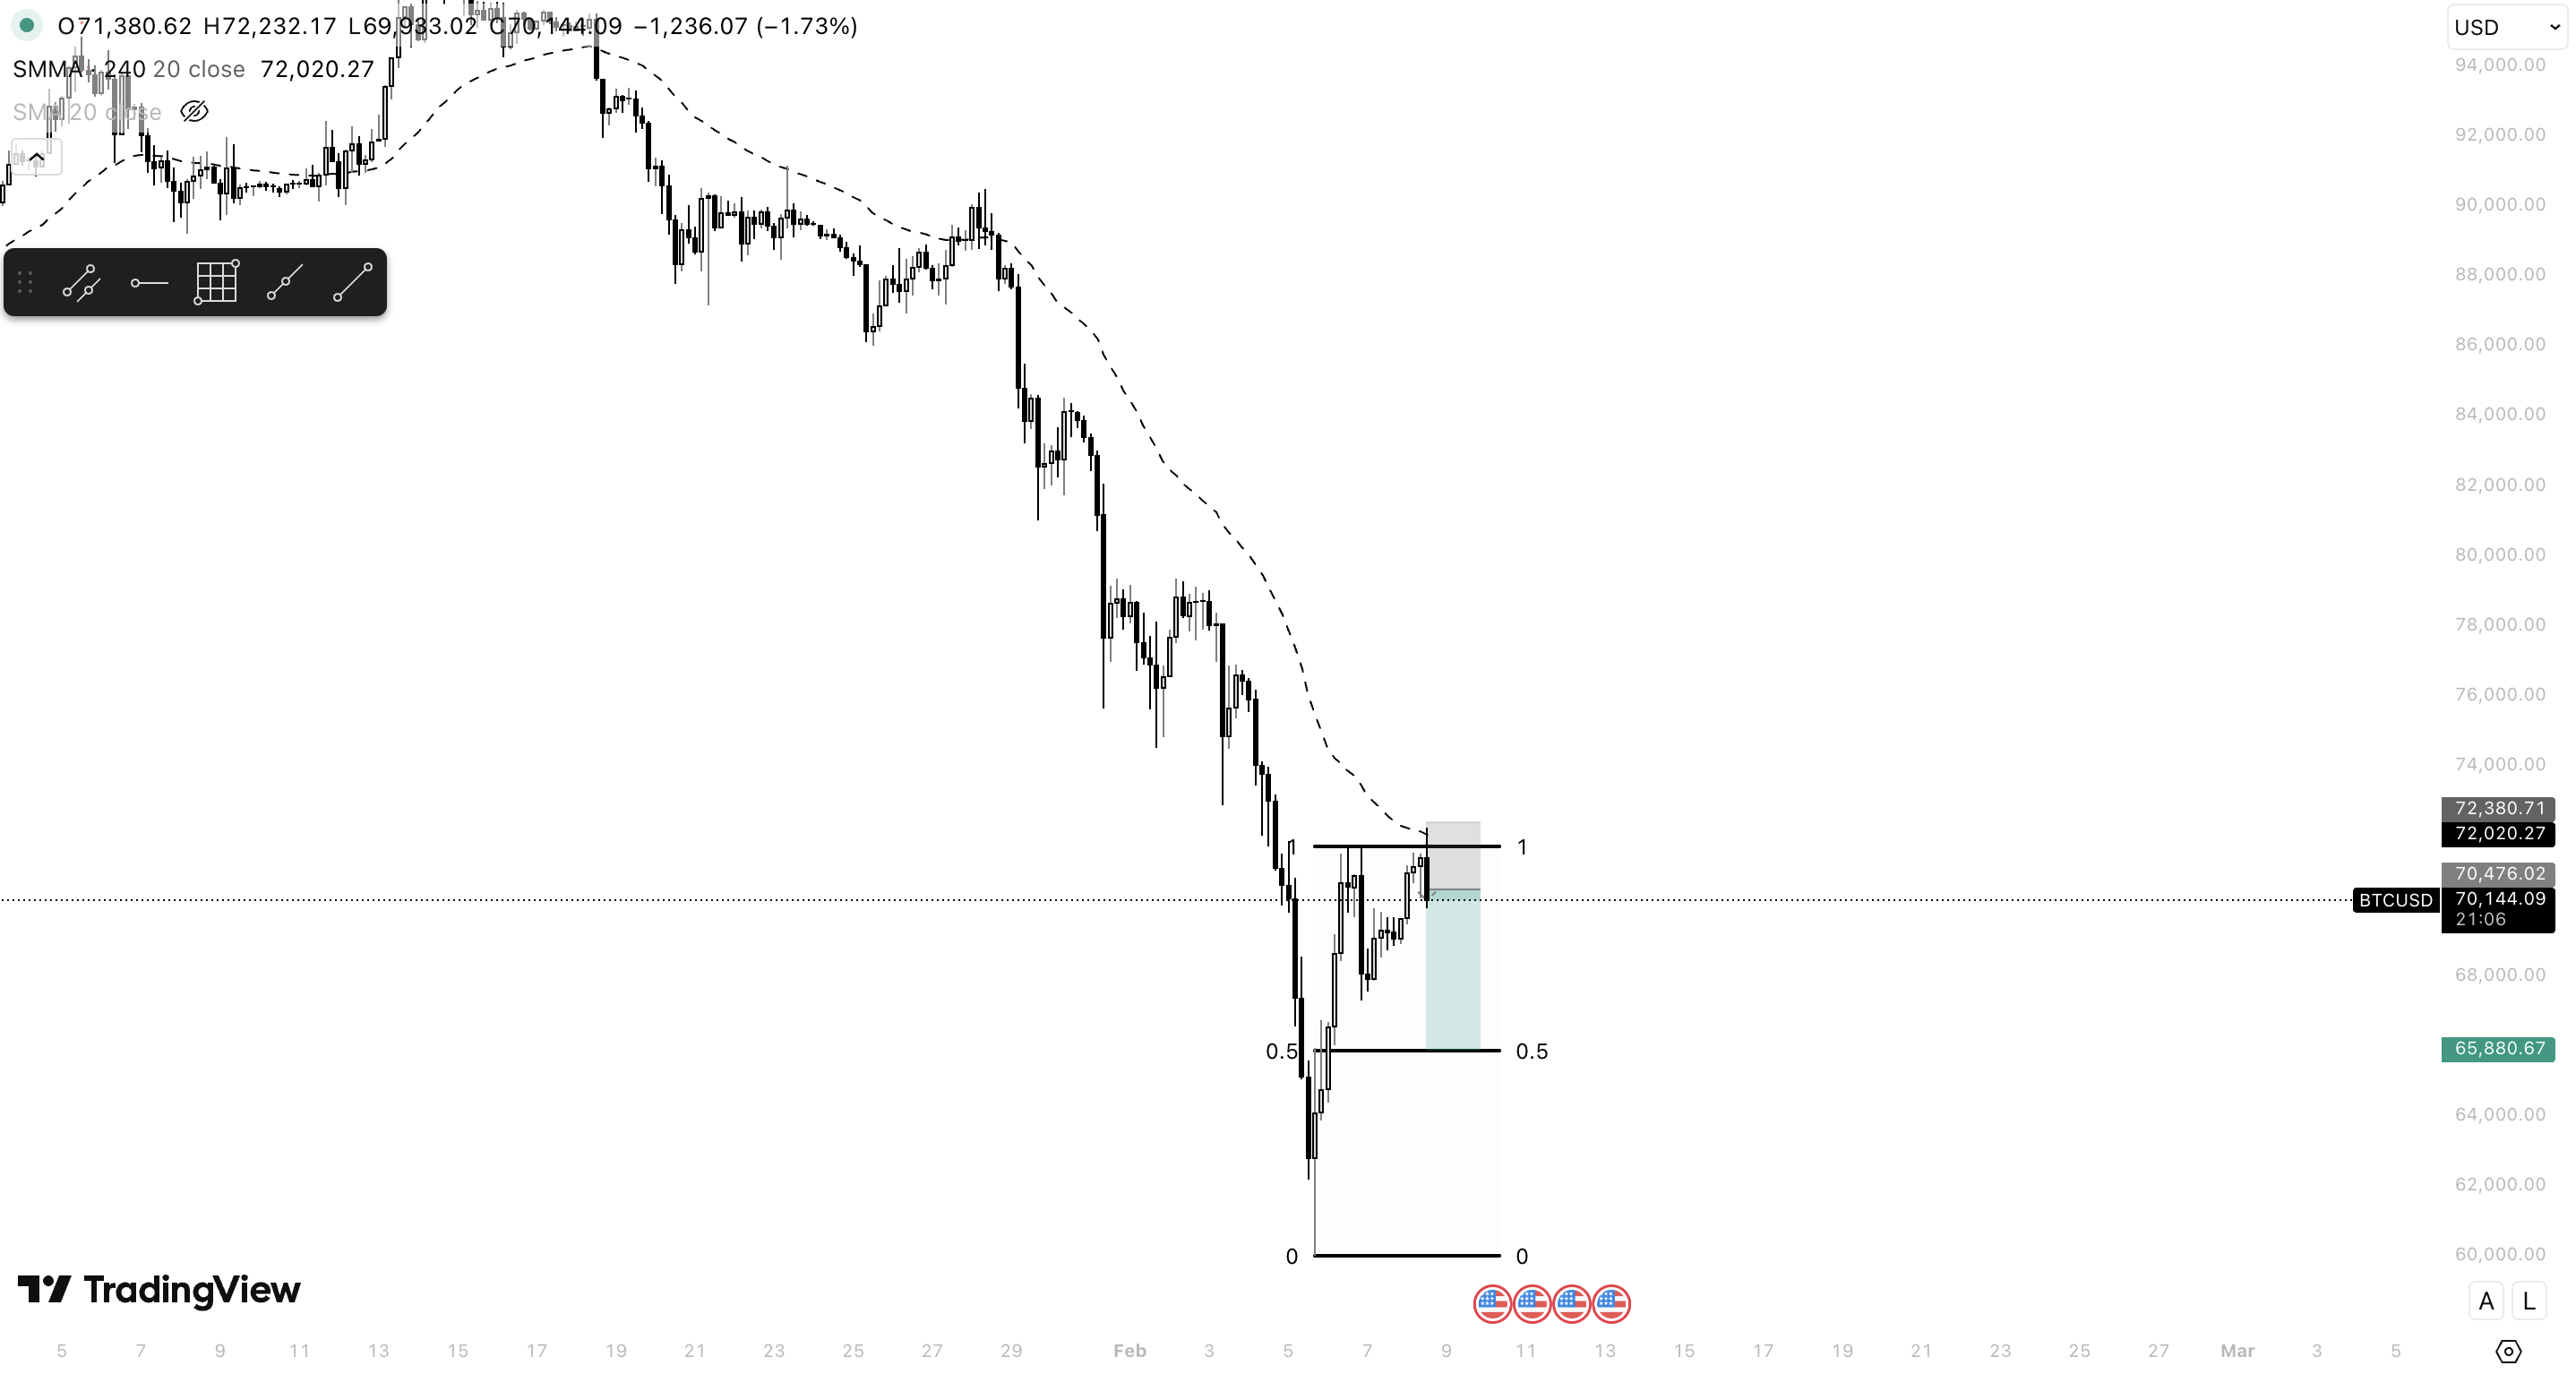
Source: TradingView
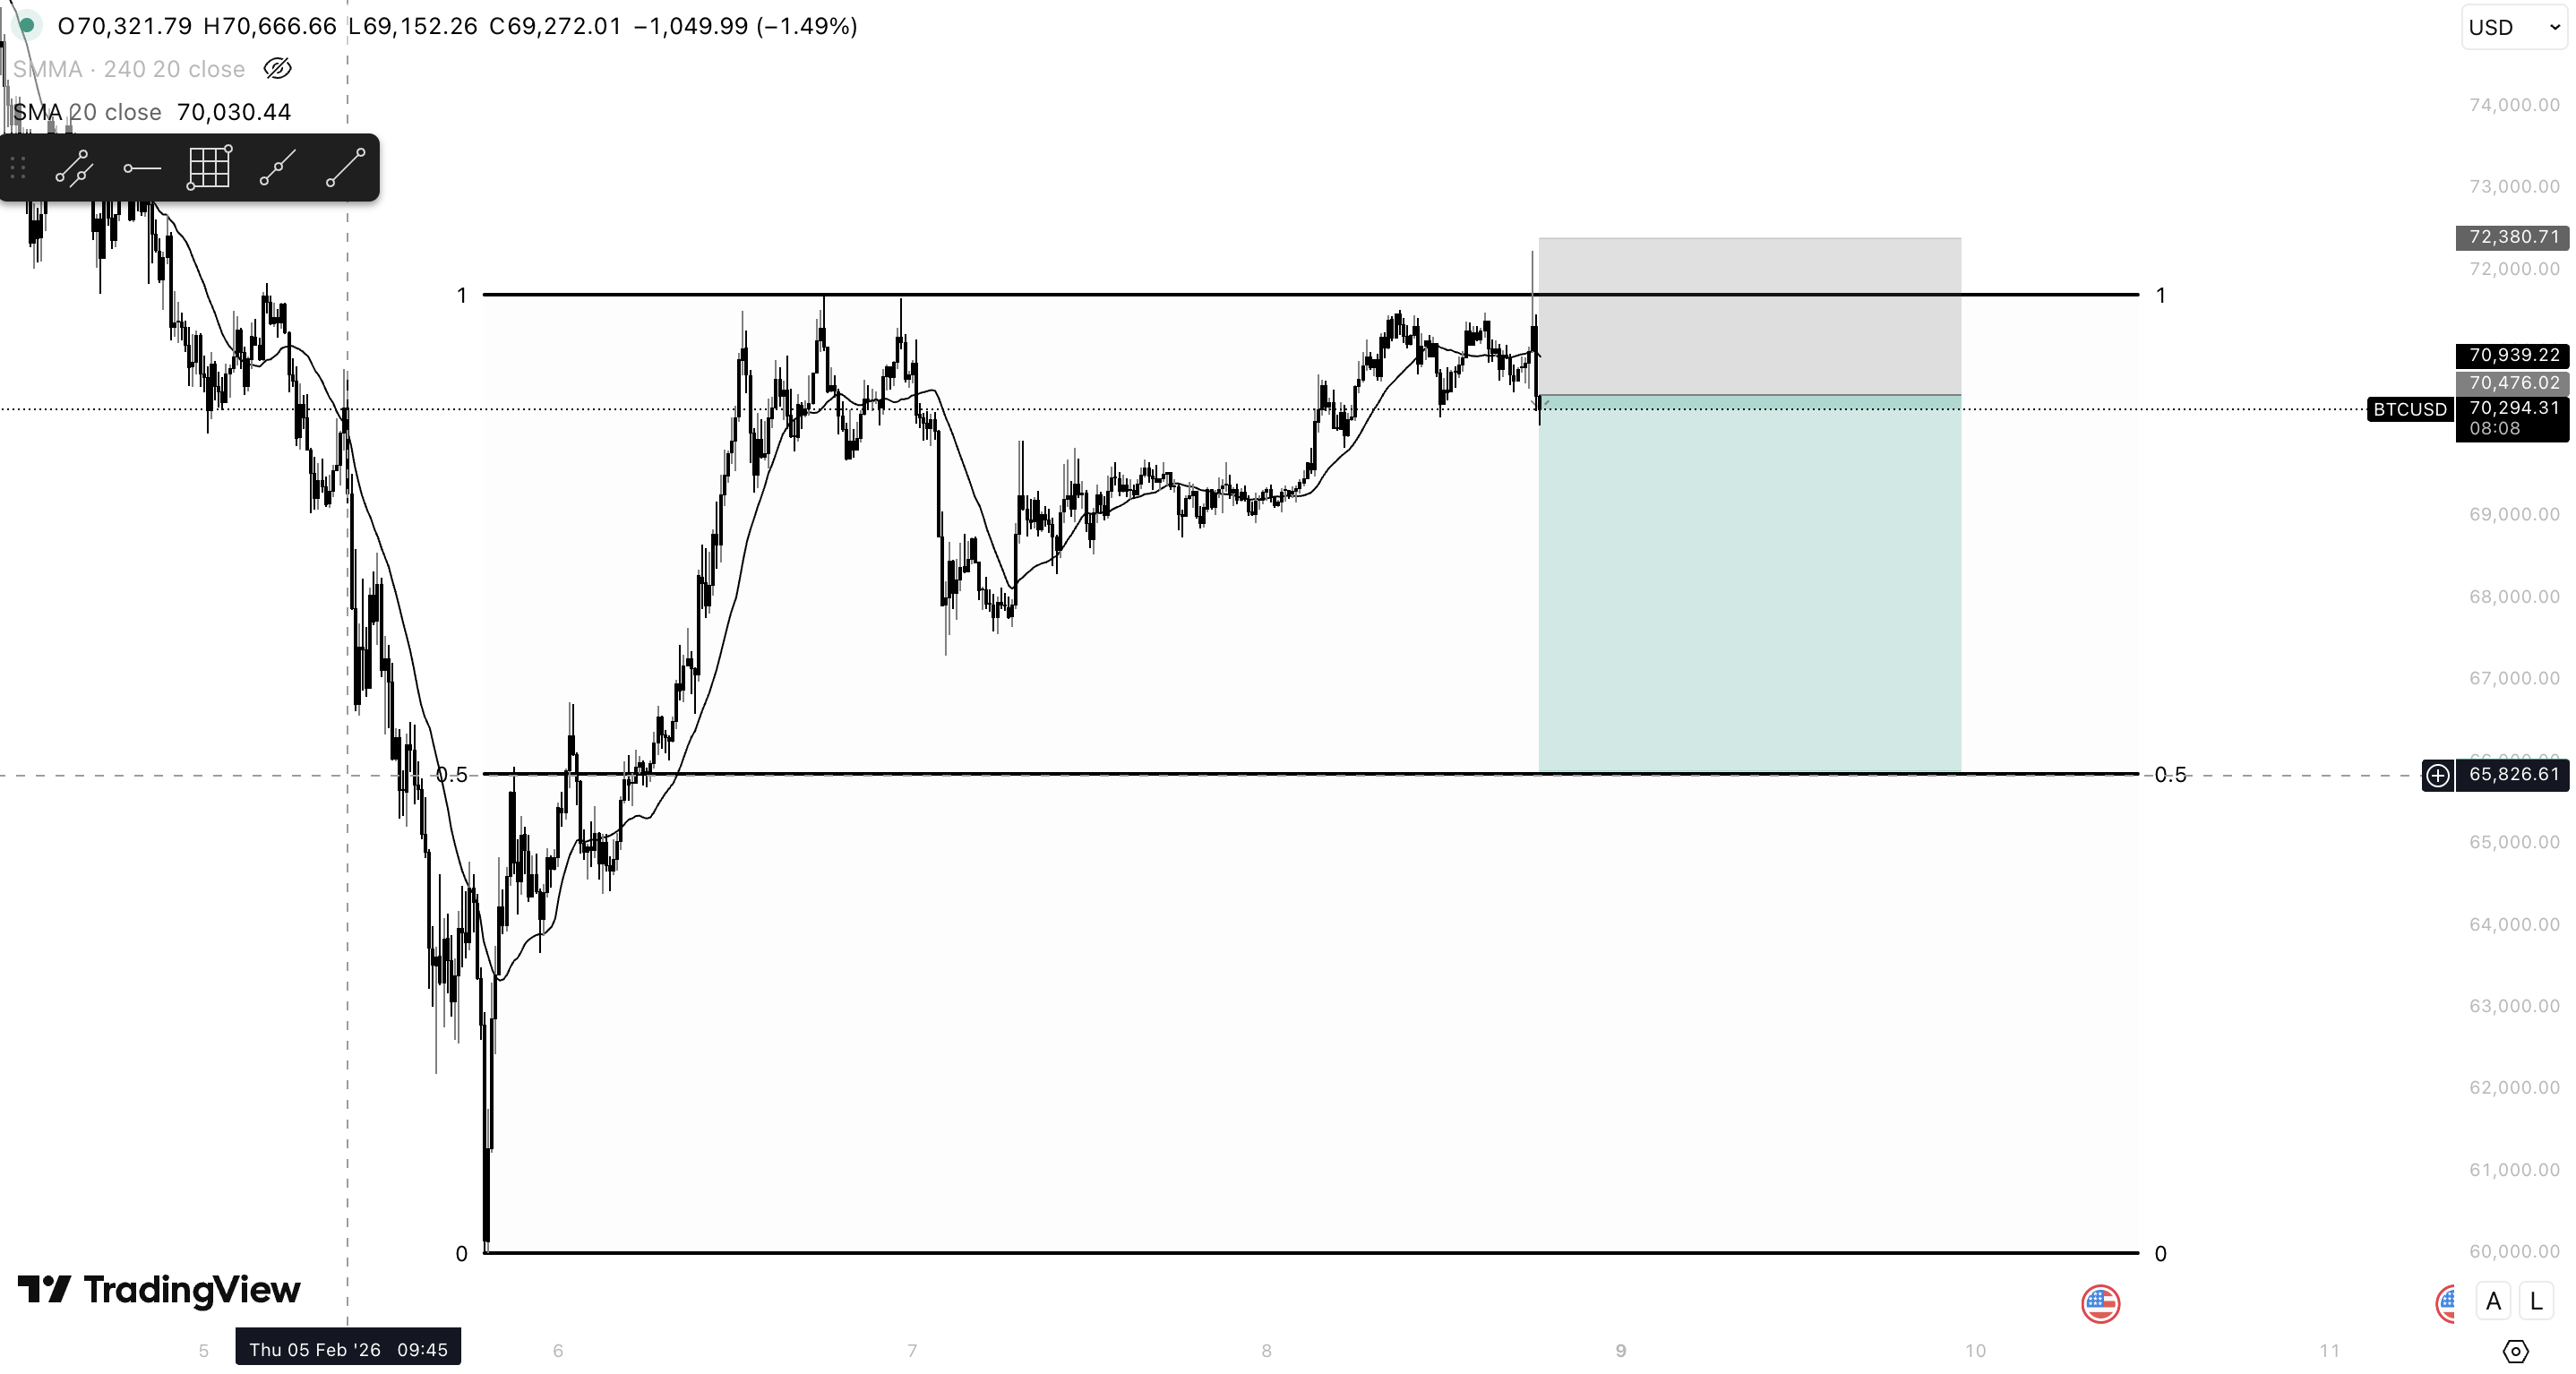
Trade Execution
Entry was planned to be within proximity of the 100 percent level of the short term range.
| Component | Details |
|---|---|
| Entry | proximity of 100 percent level following sweep |
| Stop Loss | Above liquidity sweep high |
| Target | Downward buy-side counter liquidity |
| Risk to Reward: 2.41R |
During Trade
Following entry, price initially retraced back toward the 100% level hinting that trade entry execution could have been more precise given patience, however it was followed by an aggressive sell off toward $68,300.
Price found itself trading lower into nearby liquidity that piled below consolidation on the 7th of February. As the trade has progressed, changes in liquidity distribution have begun to emerge that require active reassessment.
Initial Reaction and Range Development
After the short was established, price failed to deliver immediate downside expansion and instead has developped into a tighter range. This behaviour hints at sell-side pressure being absorbed.
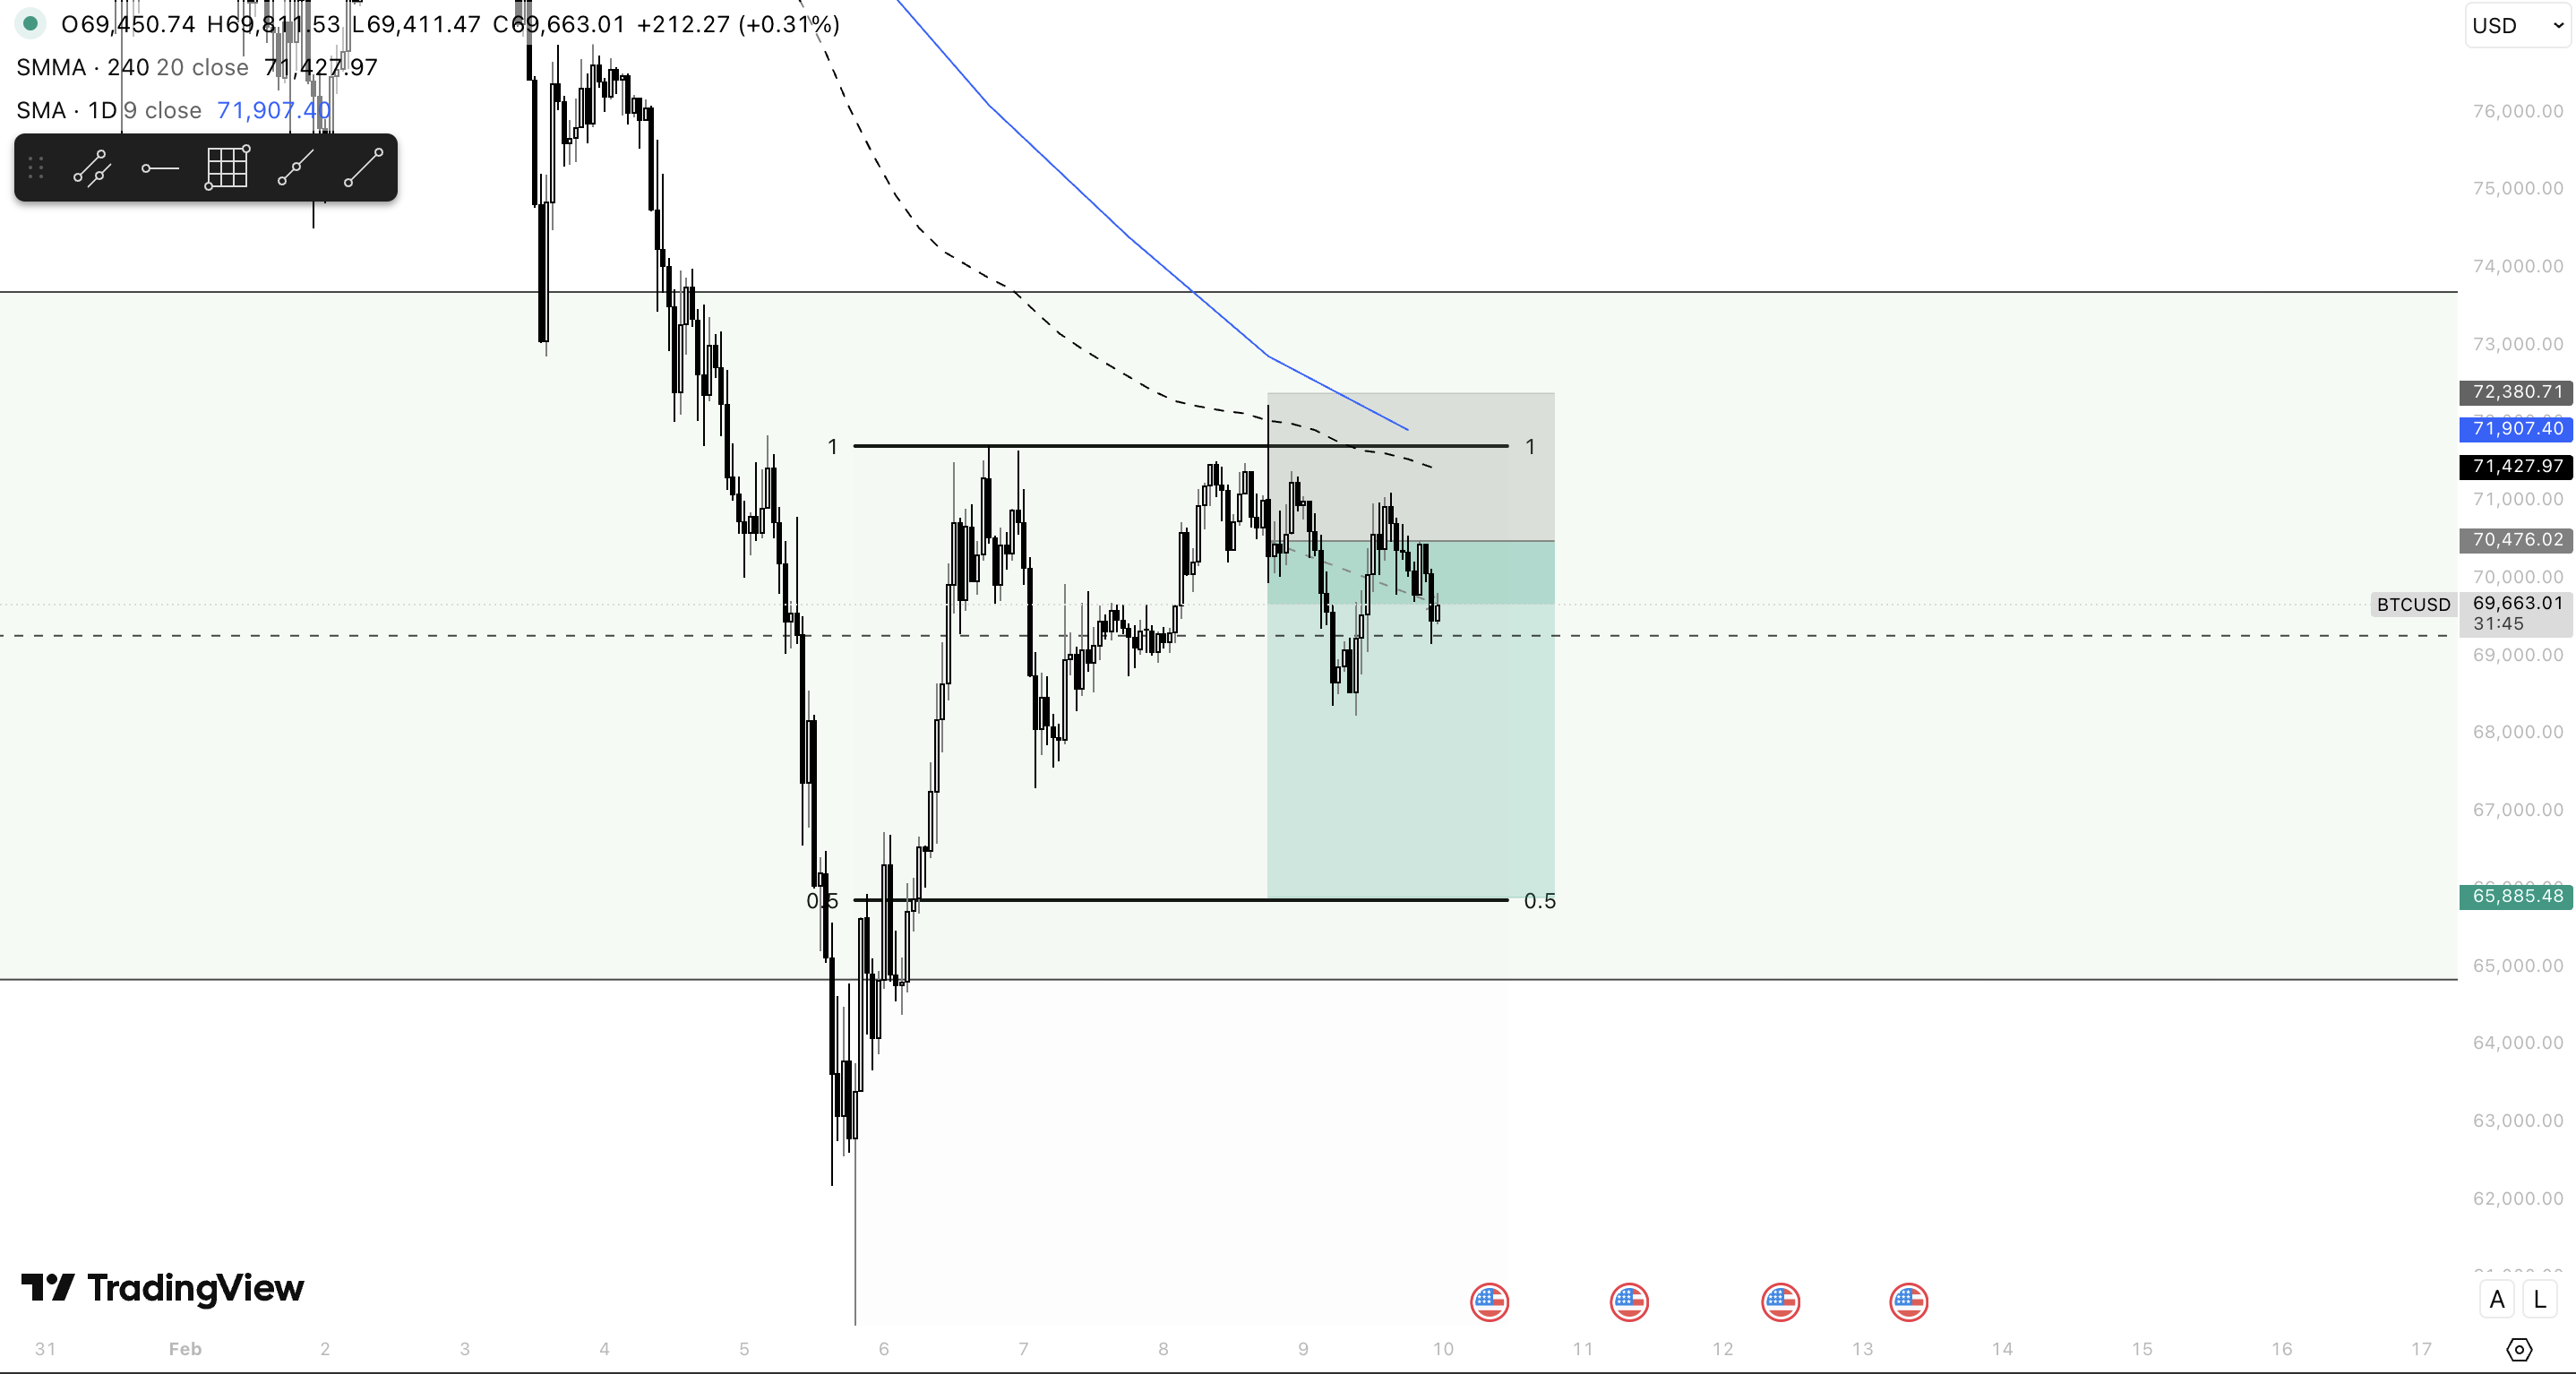
The failure to break down cleanly has shifted the trade from a momentum-based expectation toward a liquidity monitoring phase, where continuation would need to be confirmed through continuation below new pools of liquidity being formed.
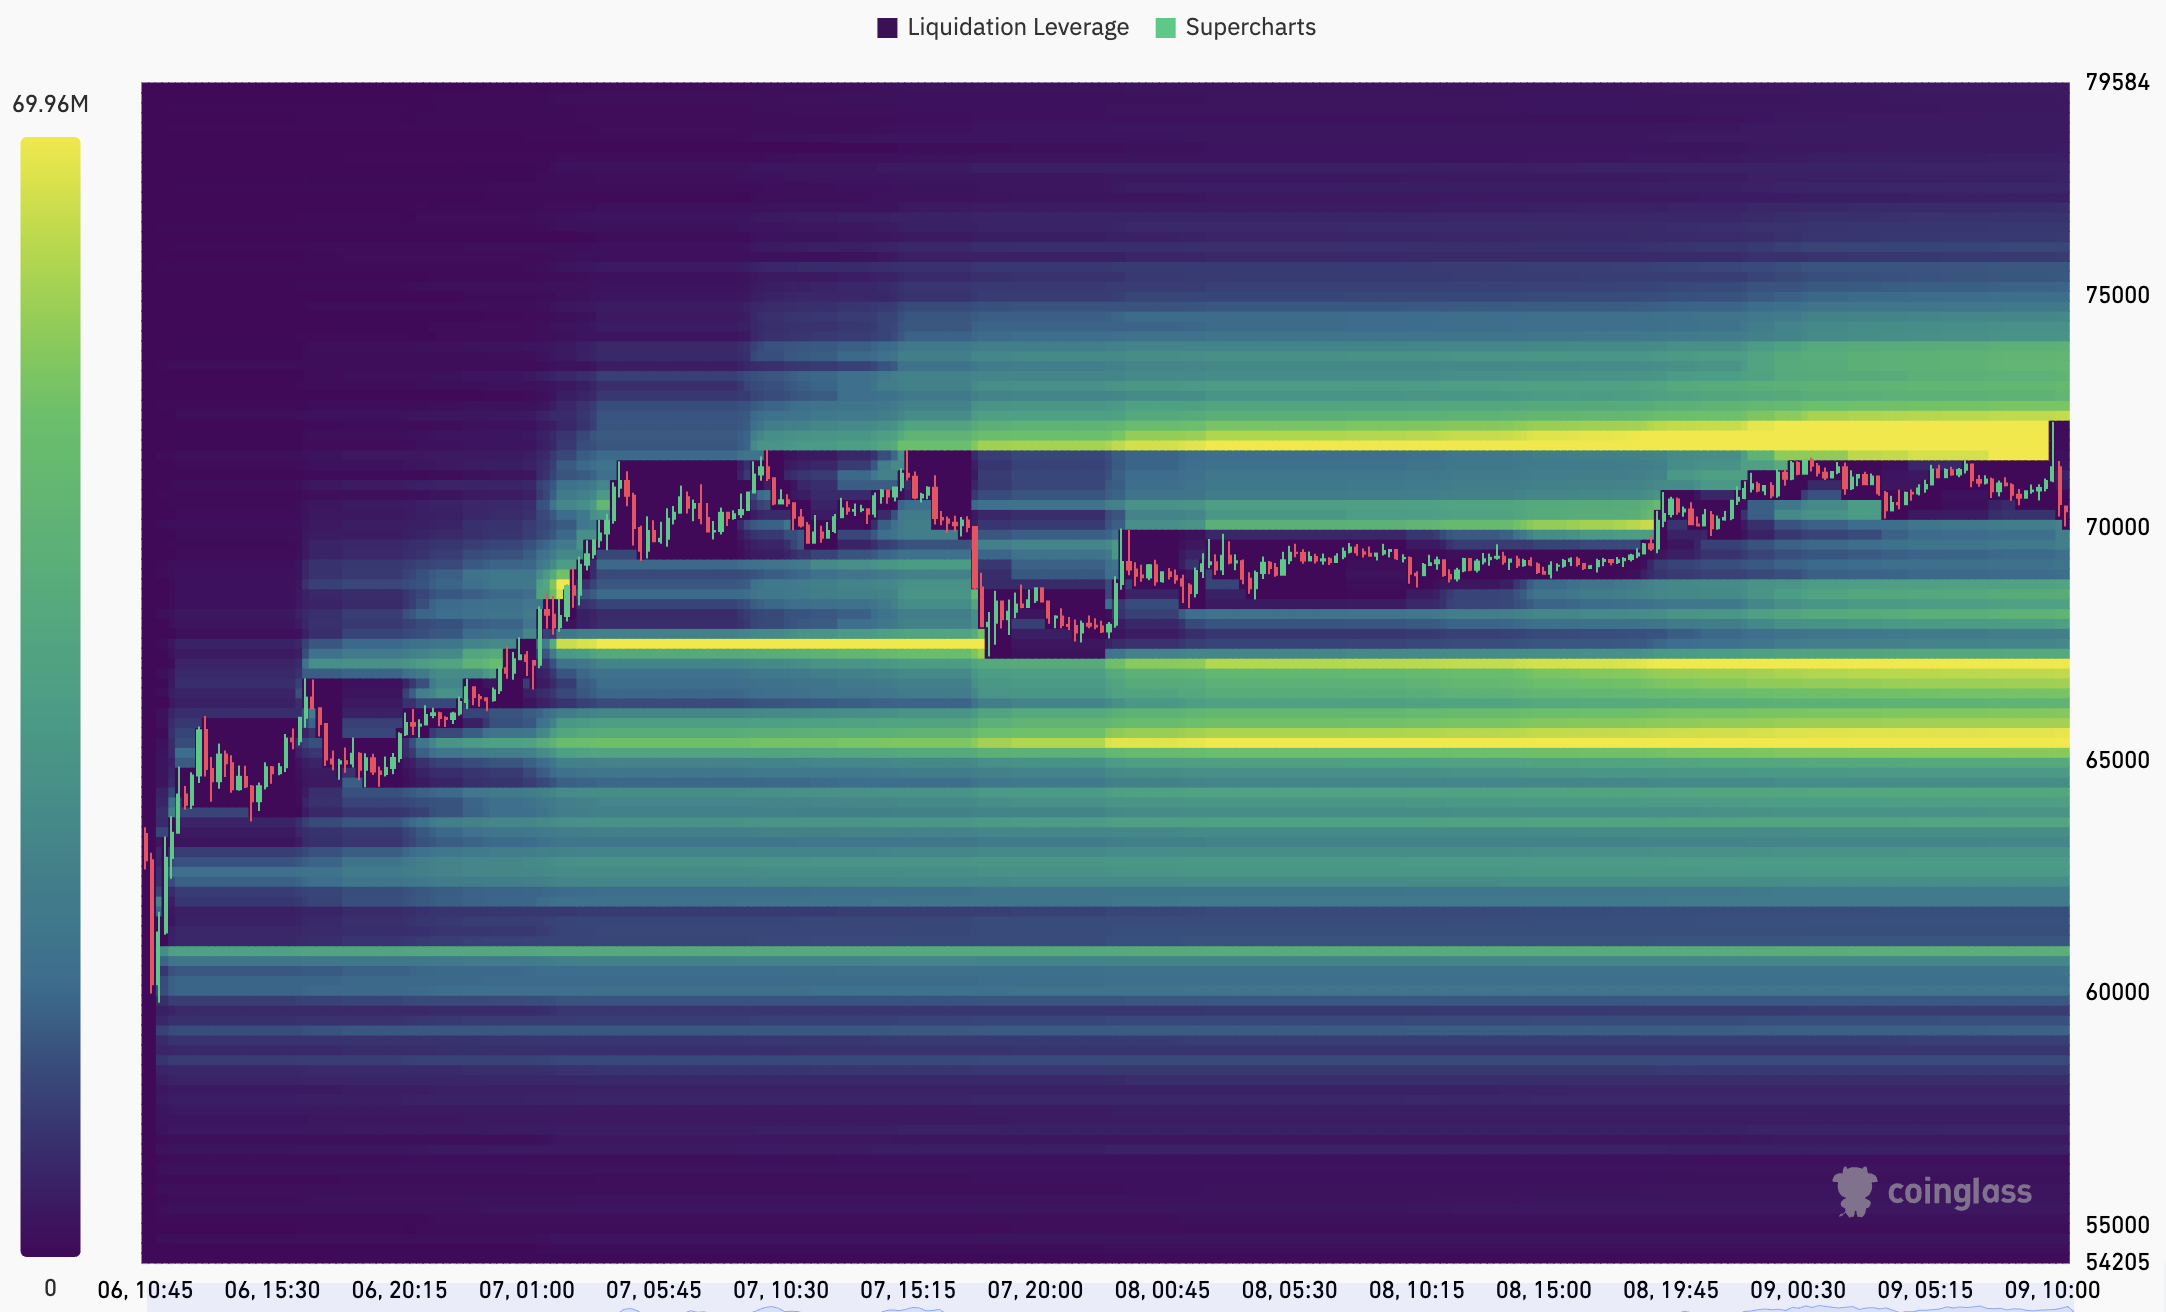
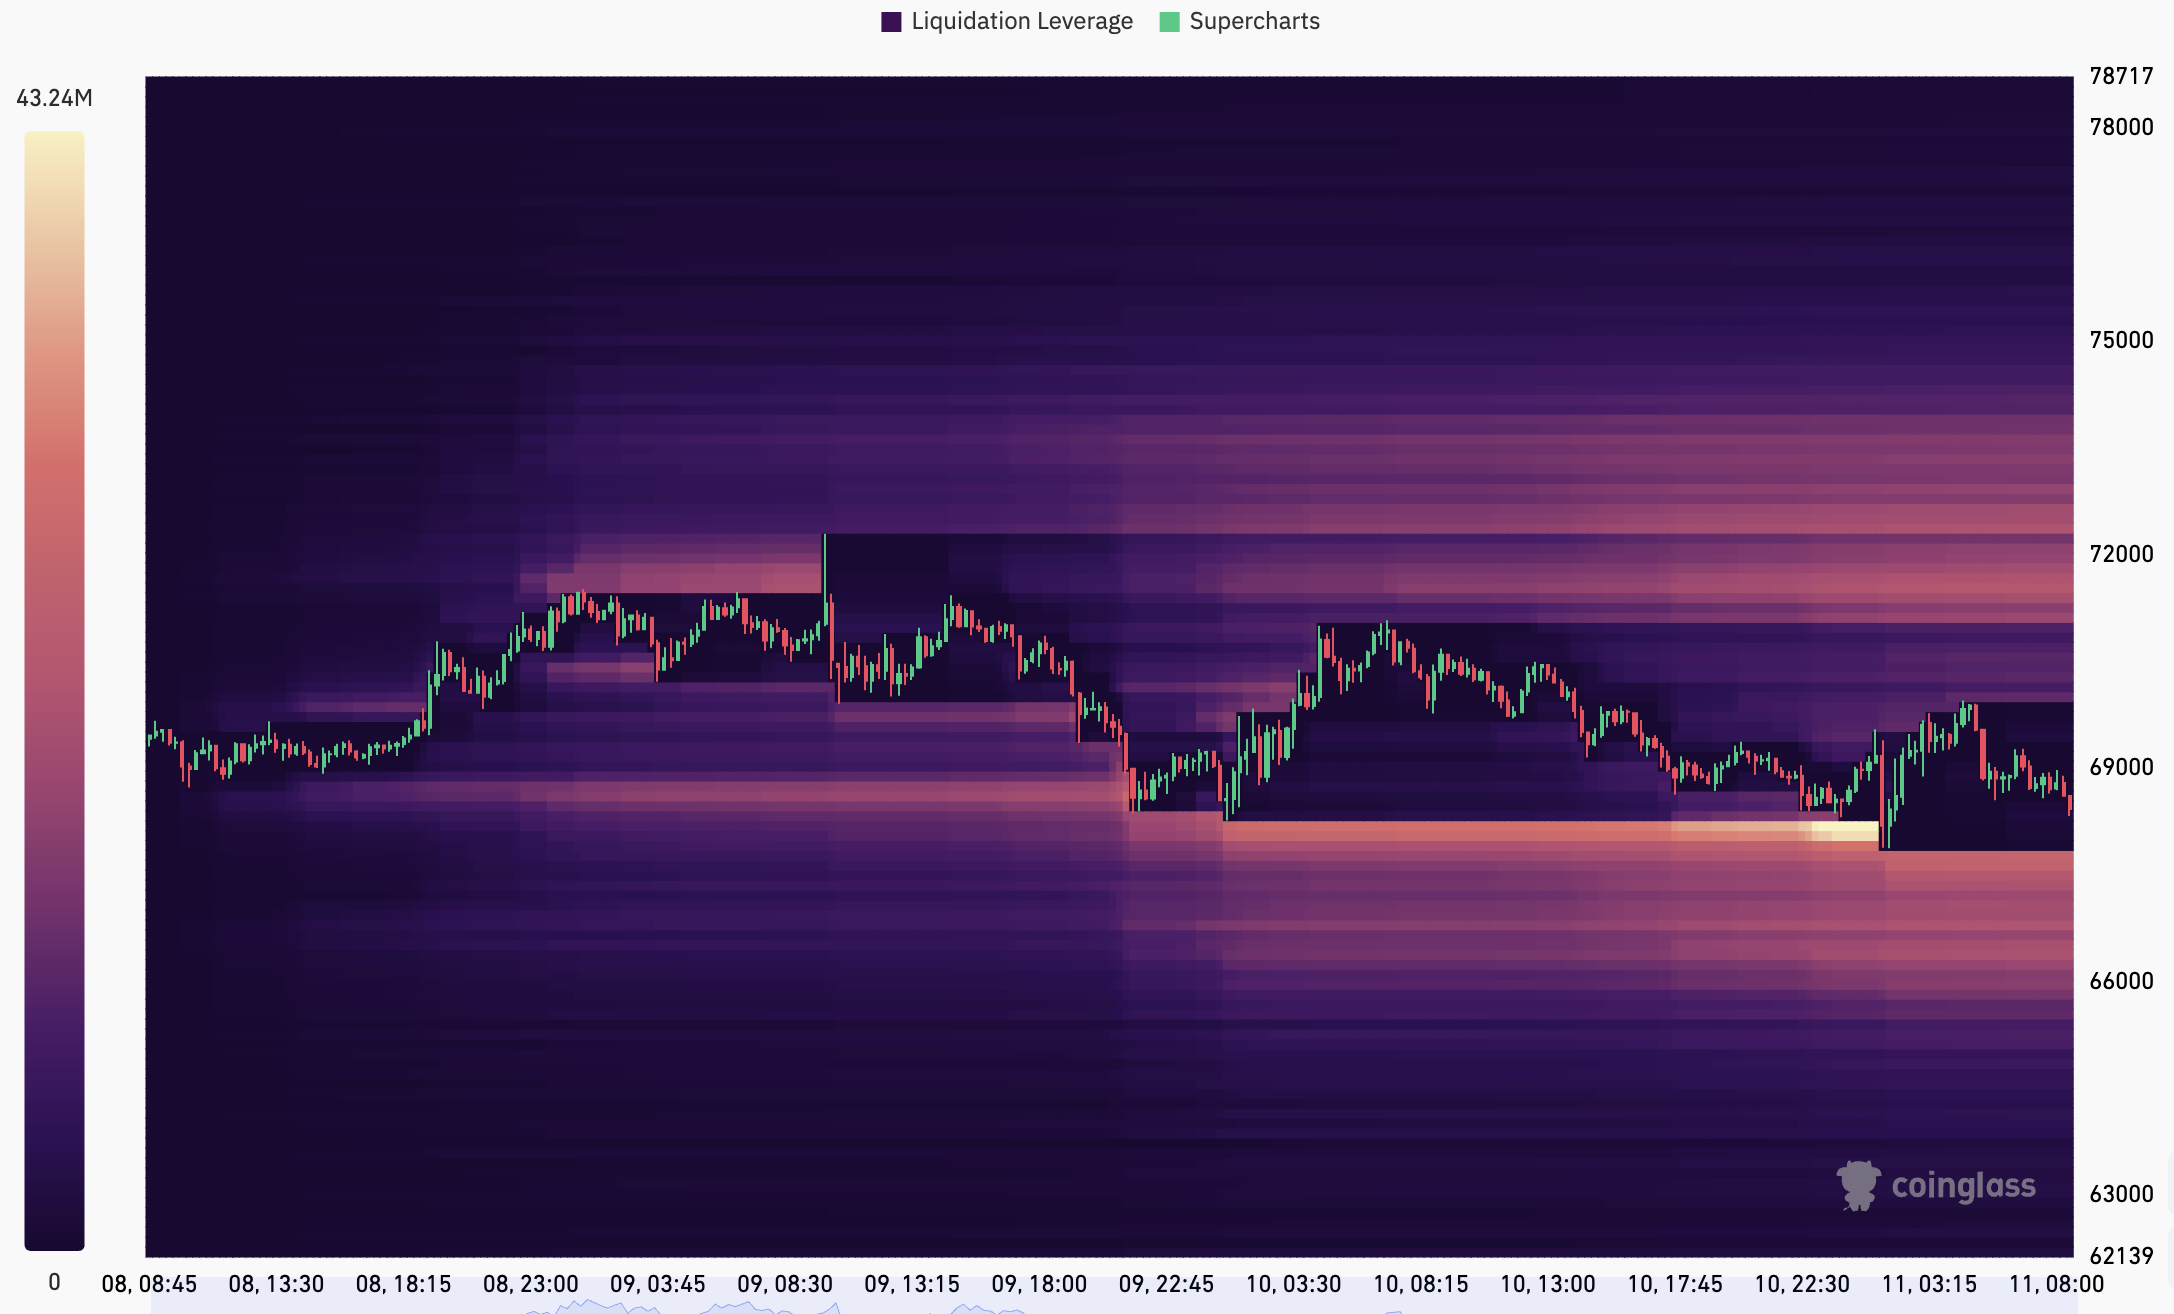
Changing Liquidity Dynamics Around 68,000
As price consolidated, a large pool of liquidity ammassing roughly 210 Million USD has been formed below the recent swing low at 68,000. If price is to continue moving higher in the short term, this zone could be targetted for filling long entries rather than the $65,300 zone that was initally pointed out as a trade exit target.
Active trade management is required when liquidity conditions evolve.
Post Trade Analysis
This section is reserved for reviewing execution quality and identifying improvements for future trades.
- Poor entry timing improvements identified.
- Stop-loss positioning appropriate.
- Price respected primary liquidity target at $68,000.