Long-Term Market Structure
The chart illustrates Silver’s historical tendency to oscillate around a persistent long-term trend, with identifiable phases of expansionary bull markets, and deeper corrections.
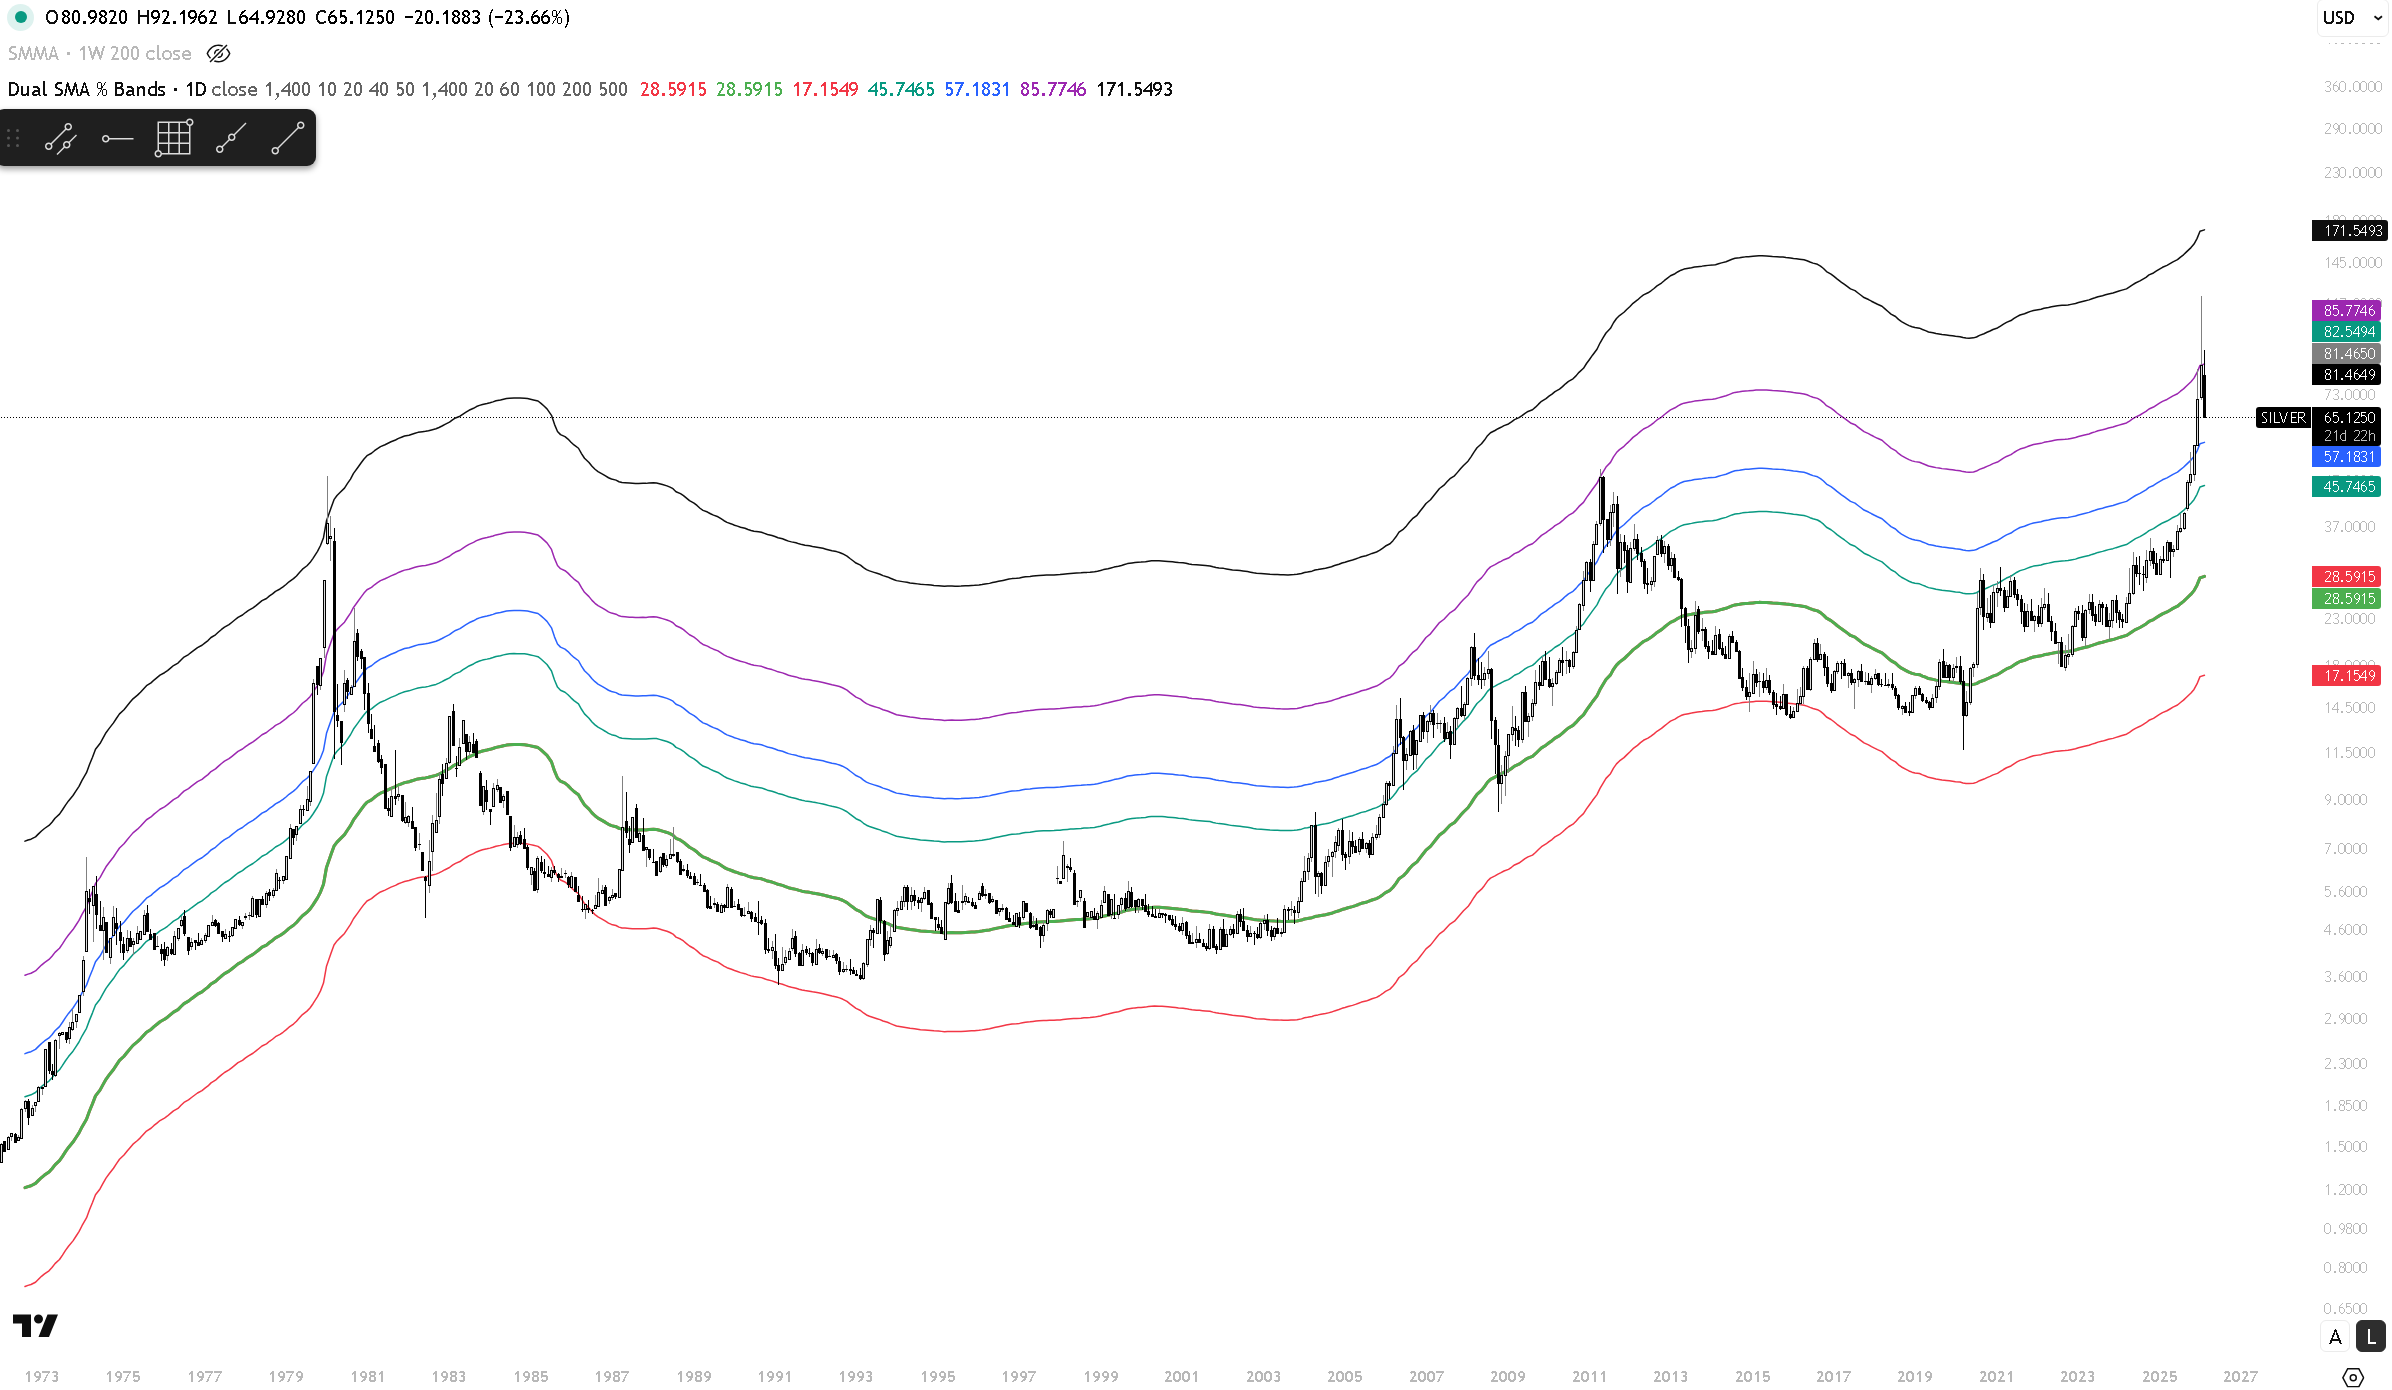
Long-term structural cycle analysis using a 1,400-day smoothed moving average and extension bands.
This material is provided for informational and educational purposes only and does not constitute financial advice.
This study examines the long-term structural behaviour of Silver using a 1,400-day smoothed moving average (SMMA) with percentage-based extension bands to track 'market euphoria' and stages of a broader market cycles. The framework is designed to contextualise price action, with price physically reacting off the extension bands as technical resistance, aswell as to measure unsustainable demand in the market.
The SMMA is intended to approximate long-duration trend equilibrium across multiple decades. Extension bands are applied as descriptive measures of historical price dispersion relative to this long-term anchor.
The chart illustrates Silver’s historical tendency to oscillate around a persistent long-term trend, with identifiable phases of expansionary bull markets, and deeper corrections.
Rather than treating price movements as isolated events, this framework presents Silver as progressing through recurring structural phases: recovery from drawdown, consolidation near the long-term average, expansion into higher deviation zones, and subsequent compression or retracement.
Upside extensions at 60%, 100%, 200%, and 500% represent progressively advanced stages of trend expansion and historical speculative intensity, while the 40% drawdown band provides a reference for contractionary phases and mean reversion within the broader cycle.
When Silver trades close to the long-term SMMA, historical behaviour has aligned with early-cycle development, signified as accumulation zones. Sustained movement into higher extension bands reflects increasing distance from structural equilibrium and has typically coincided with later-stage cycle conditions, particularly toward 500% extension.
Conversely, prolonged movement toward the drawdown band has occurred during extended periods of contraction, where volatility compresses and long-term structural support is tested.
This framework is descriptive rather than predictive. Its purpose is to document where price resides relative to its historical macro structure, providing a disciplined lens for assessing cycle positioning in the precious metals market.