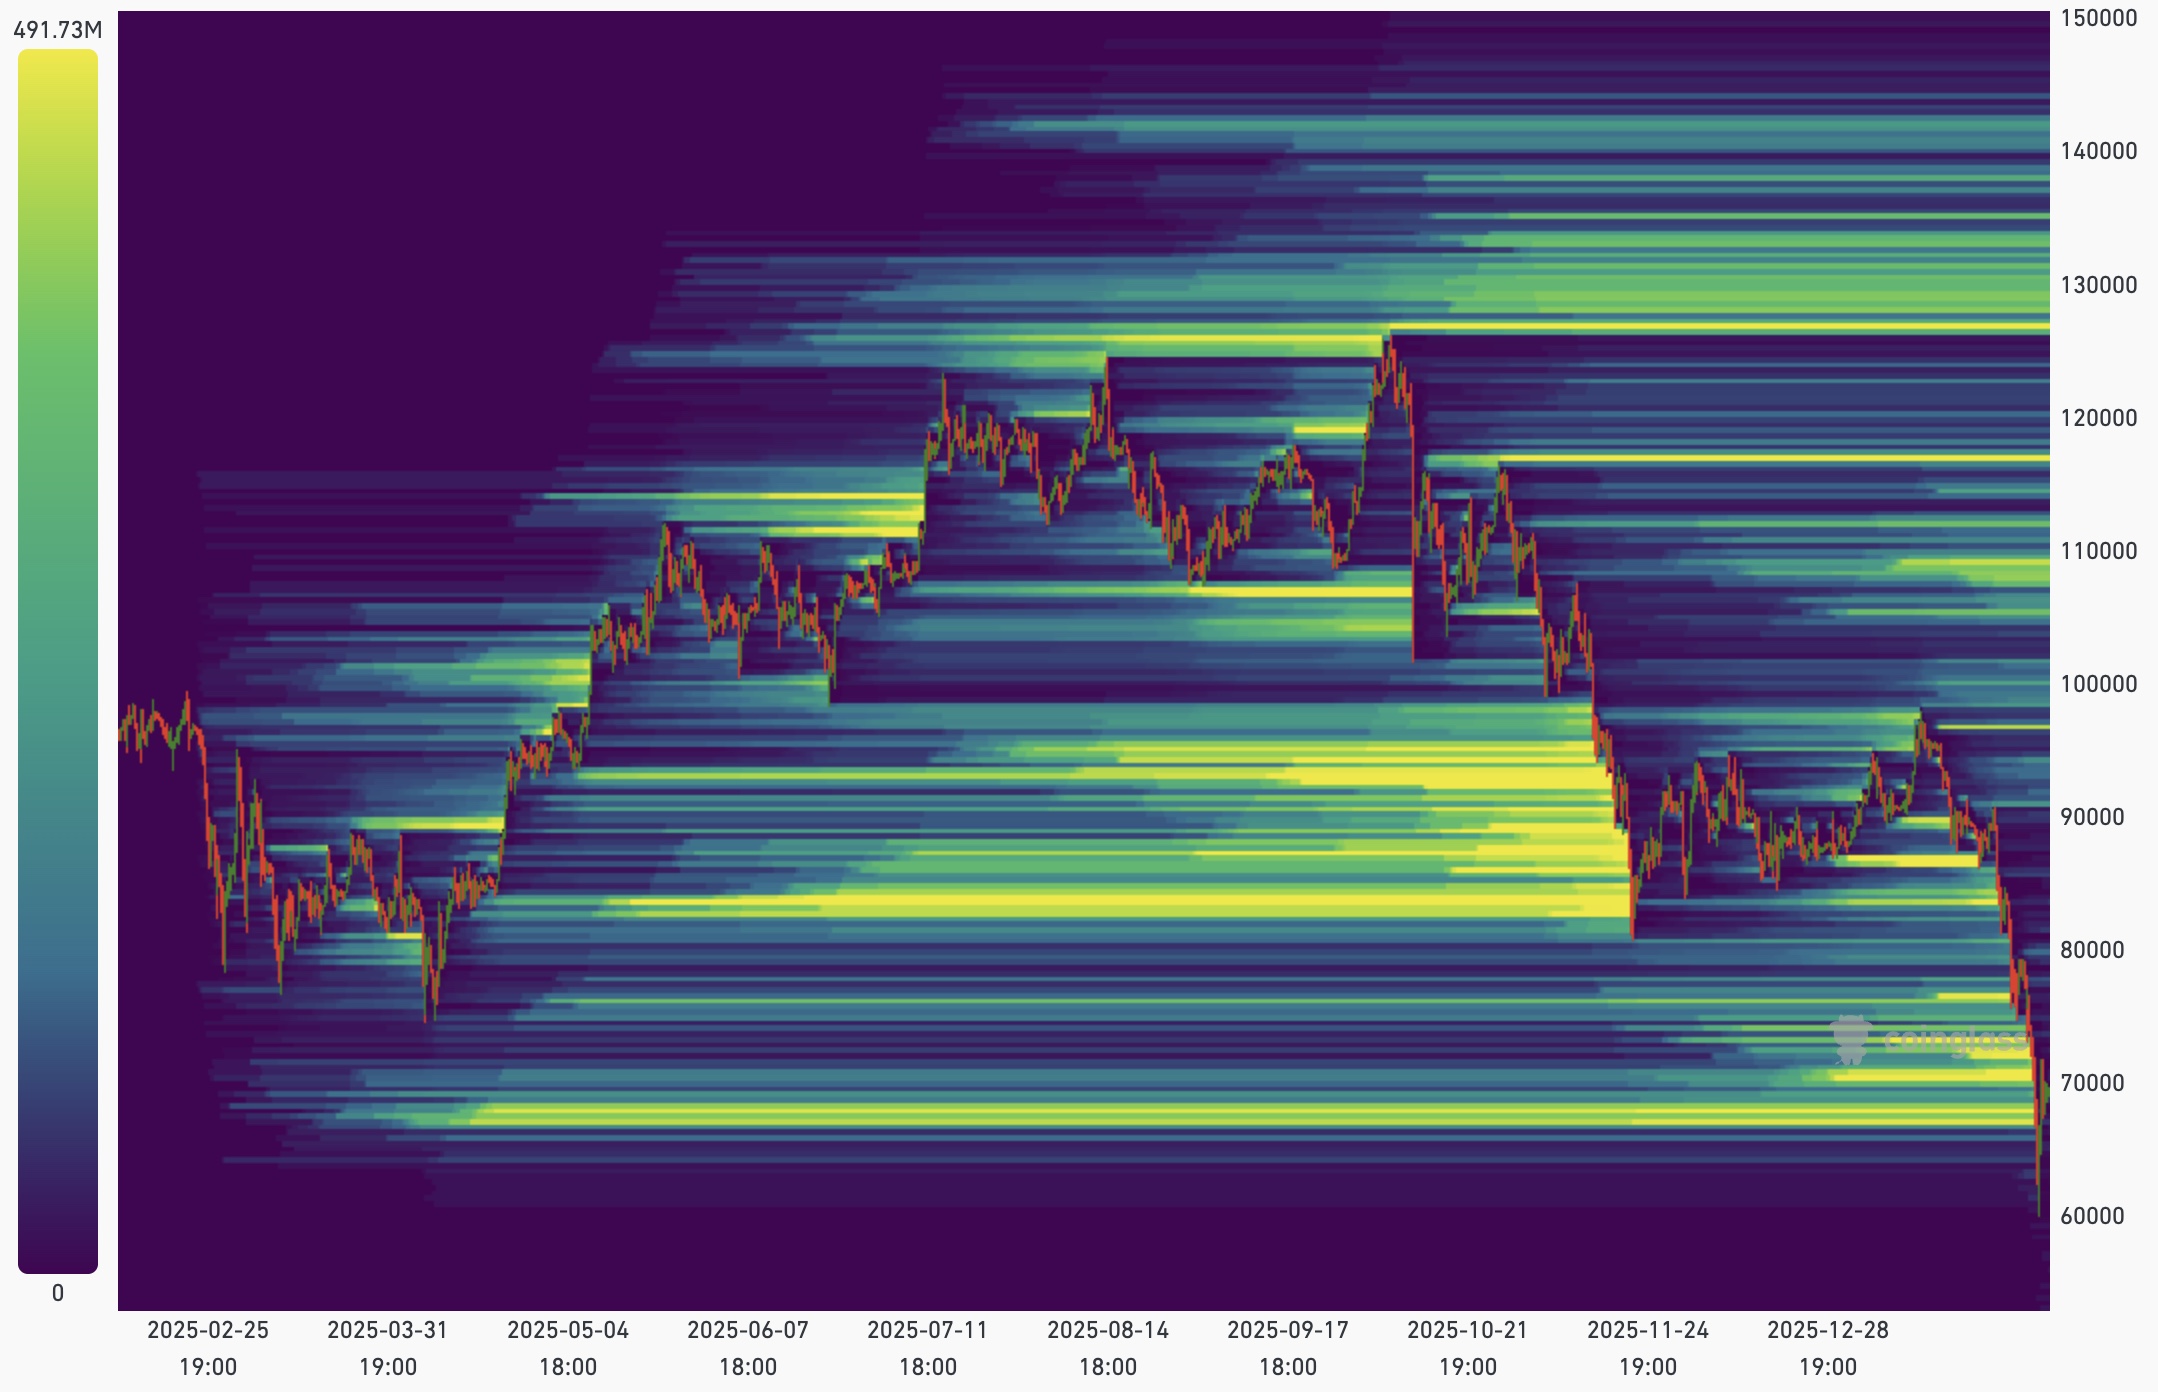
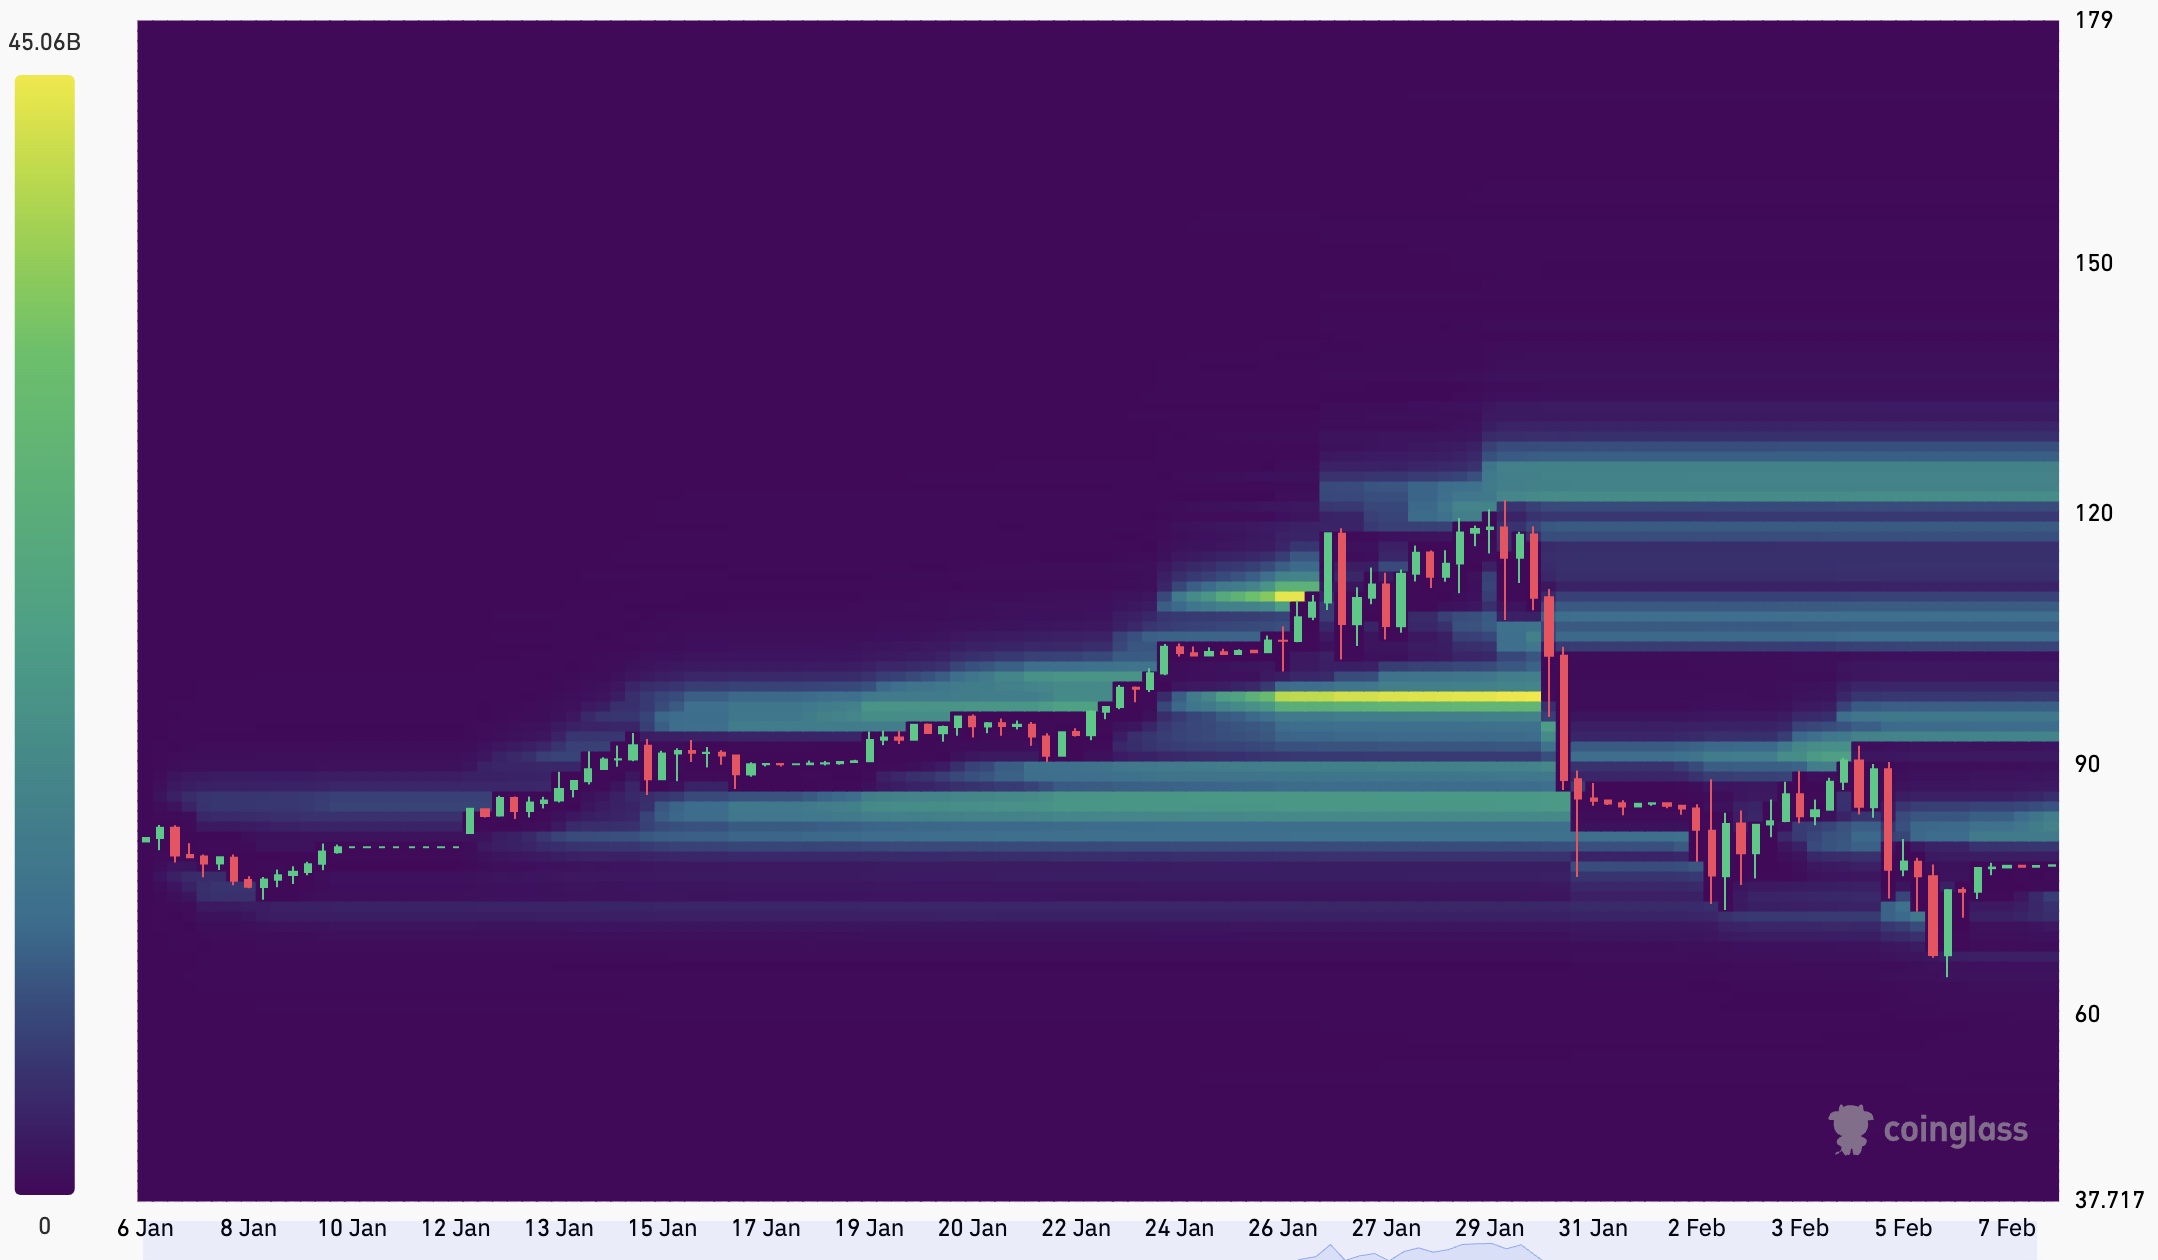
A structural framework for understanding forced order flow, technical structure, and institutional execution dynamics.
This material is provided for general informational and educational purposes only. It does not constitute financial advice or a recommendation.
Liquidation heatmaps visualise concentrations of forced, non-discretionary orders embedded within leveraged markets. Unlike traditional volume or order book metrics, these zones represent price levels where participants must transact if reached.
This makes liquidation data particularly useful for analysing how large, institution-sized positions are executed without significant price impact.
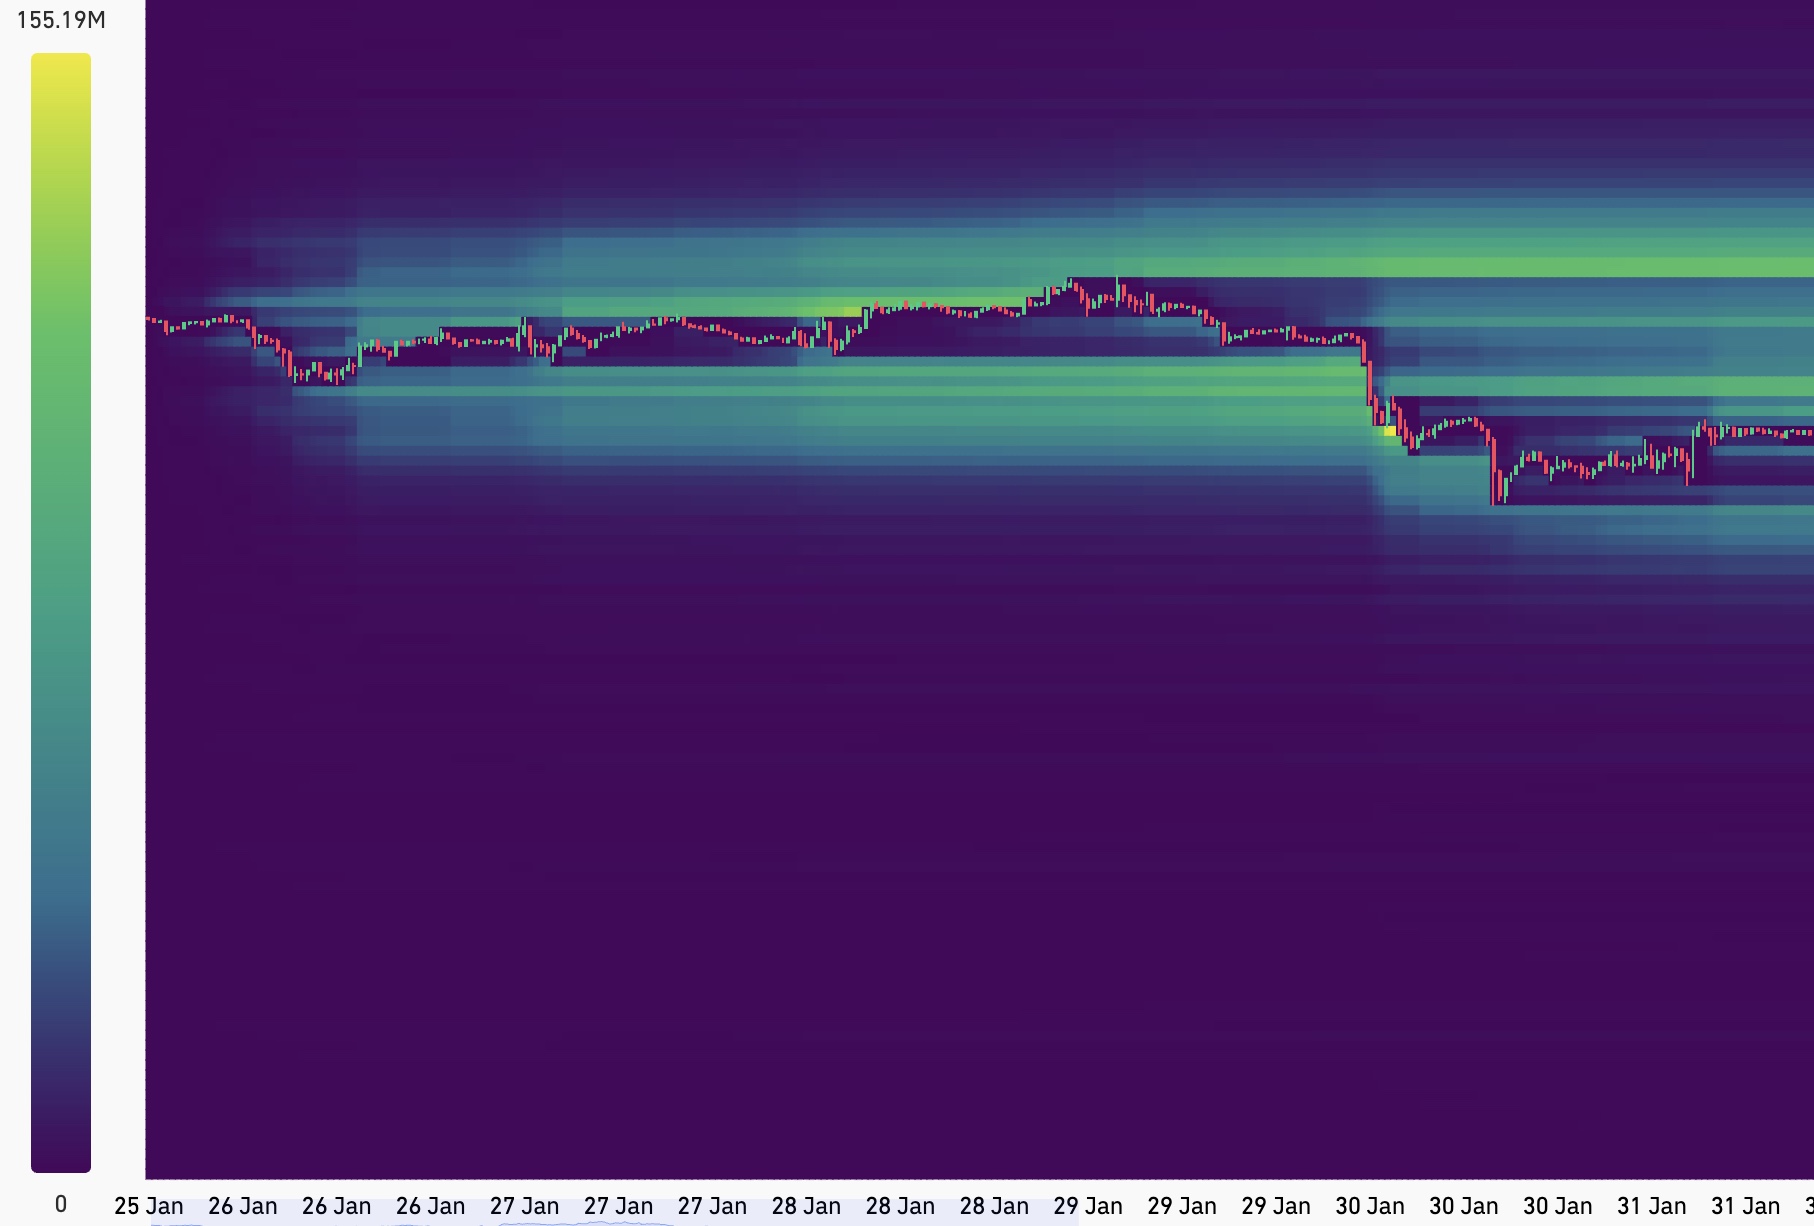
A liquidation heatmap aggregates estimated liquidation thresholds across derivatives venues. These thresholds are primarily composed of:
These orders are mechanical and automatic. They are not discretionary decisions made in real time, but deterministic outcomes of leverage, margin, and exchange rules.
When price enters a dense liquidity zone, execution is effectively guaranteed. The only variable is which participants are positioned to absorb that forced flow.
Large participants cannot execute meaningful size into illiquid markets without incurring slippage. As a result, execution requires a dense pool of opposing orders at relatively stable prices.
Liquidation clusters provide this counter-liquidity by concentrating:
Price therefore often migrates toward liquidation zones not because they are predictive targets, but because they are usable liquidity reservoirs.
This behaviour is frequently misinterpreted as volatility or randomness, when it more accurately reflects liquidity-seeking execution.
Classical technical analysis identifies structural features such as channels, ranges, and trend boundaries. These frameworks describe where price has historically reacted, but not the underlying execution dynamics.
In this example, the lower boundary of a parallel channel aligns with a dense liquidation zone. The subsequent breakout reflects price freefalling into a pool of forced sell orders, providing directional continuation that traders seek to profit from.
This reframes technical breakouts as liquidity events rather than purely sentiment-driven failures.
After extended declines, large liquidation clusters are often fully consumed. Once these zones are cleared, price may enter regions with minimal remaining forced order flow. Price tends to have short/medium term reactions from such levels as large scale orders are filled and price gravitates to liqudiity flows in the opposite direction.
These liquidity voids are characterised by diminishing downside momentum, stabilising price action, and reduced volatility. This is not just because of strong demand, but also from the exhaustion of forced sellers.
A recent deep correction in Silver provides a parallel example. After sweeping multiple high-density liquidation zones, price entered a region with negligible remaining forced order concentration.
Downside continuation stalled within this liquidity void since limited counter-liquidity available alludes to the fact that large institutional trading firms filled short to mid term buy orders at the lowest possible price without slippage.
This illustrates the critical principle that markets require both buyers and the absense of mechanical sell-side pressure to stop falling.
Liquidation heatmaps are not predictive tools. They do not define direction, timing, or certainty.
Instead, they provide structural context for:
When integrated with technical structure, liquidation data can enhances risk management by grounding decisions within mechanical market constraints.